DataCore SANSymphony Server
Configure the Metrics Export
Open the SANsymphony-V Performance Monitor Configuration program. Make sure you see the same screen as shown below, as there are 2 different Performance Monitor Tools.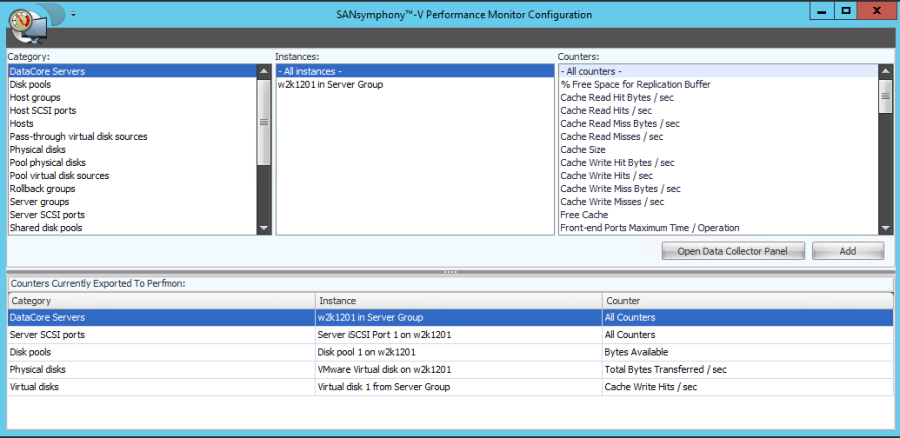
You can find a more detailed guideline by DataCore, how to work with Performance Monitor Configuration: http://datacore.custhelp.com/app/answers/detail/a_id/1676
Add the following counters to be exported:
Category: DataCore Servers
Instances: All Instances
Counters:
- “Cache Size”
- “Cache Read Hits / sec”
- “Cache Read Misses / sec”
- “Cache Write Hits / sec”
- “Cache Write Misses / sec”
- “Total Reads / sec”
- “Total Writes / sec”
- “Cache Read Hit Bytes / sec”
- “Cache Read Miss Bytes / sec”
- “Cache Write Hit Bytes / sec”
- “Cache Write Miss Bytes / sec”
- “Free Cache”
- “Total Bytes Transferred / sec”
- “Total Bytes Read / sec”
- “Total Bytes Written / sec”
- “Total Operations / sec”
- ”% Free Space for Replication Buffer”
Category: DataCore Server SCSI ports
Instances: All Instances
Counters:
- Average Time / Target Read
- Average Time / Target Write
- Target Operations / sec
- Target Reads / sec
- Target Writes / sec
- Target Bytes Transferred / sec
- Target Bytes Read / sec
- Target Bytes Written / sec
- Pending Target Commands
- Average Time / Initiator Read
- Average Time / Initiator Write
- Initiator Operations / sec
- Initiator Reads / sec
- Initiator Writes / sec
- Initiator Bytes Transferred / sec
- Initiator Bytes Read / sec
- Initiator Bytes Written / sec
- Pending Initiator Commands
Category: DataCore Disk pools
Instances: All Instances
Counters:
- % Allocated
- % Available
- Bytes Allocated
- Bytes Available
- Average Time / Read
- Average Time / Write
- Total Operations / sec
- Total Bytes Transferred / sec
- Total Bytes Read / sec
- Total Bytes Written / sec
Category: DataCore Physical Disk
Instances: All Instances
Counters:
- Average Time / Read
- Average Time / Write
- Total Bytes Transferred / sec
- Total Bytes Read / sec
- Total Bytes Written / sec
- Total Pending Commands
Category: DataCore Virtual Disks
Instances: All Instances
Counters:
- Bytes Out Of Affinity
- Total Bytes Transferred / sec
- Total Operations / sec
Close SANsymphony-V Performance Monitor Configuration program after the change!
Download and Install the DataCollection Service
Download Link – opvizor-datacore Datensammler: https://opvizor-perfanalyzer.s3-eu-west-1.amazonaws.com/Datacore/opvizor-datacore.zip
Unblock the archive! Please make sure to unblock the downloaded archive: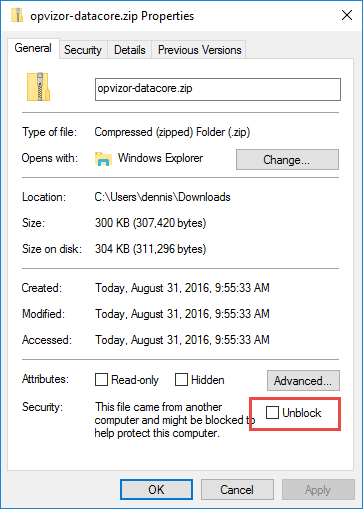
Unzip the content of opvizor-datacore zip file to a directory you want the application to run from, our recommendation is C:\Program Files\telegraf
Now you need to change the string pa_appliance_ip in the telegraf.conf file urls = [“http://pa_appliance_ip:8086”] to the IP address or network name of the Performance analyzer virtual appliance.
Open a Windows Command Line or PowerShell Session having administrative rights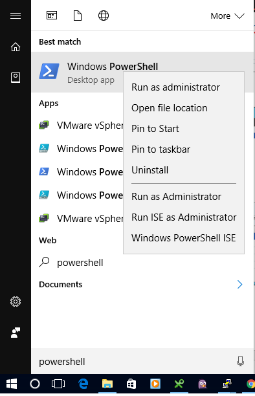
Run the following command:
“C:\Program Files\Telegraf\telegraf.exe” –config “C:\Program Files\Telegraf\telegraf.conf” –config-directory “C:\Program Files\Telegraf\telegraf.d” –service install
That installs the Data collection service and it collects the MS Windows data of the server as well as the datacore data.
If you want to collect Windows data from the other Datacore hosts in the cluster as well, please install telegraf as well, but delete the “C:\Program Files\Telegraf\telegraf.d” folder!
To manage the telegraf data collector:
net stop telegraf
net start telegraf
Virtual Appliance
Create a new data source
Add the Datacore data source named DataCoreInflux: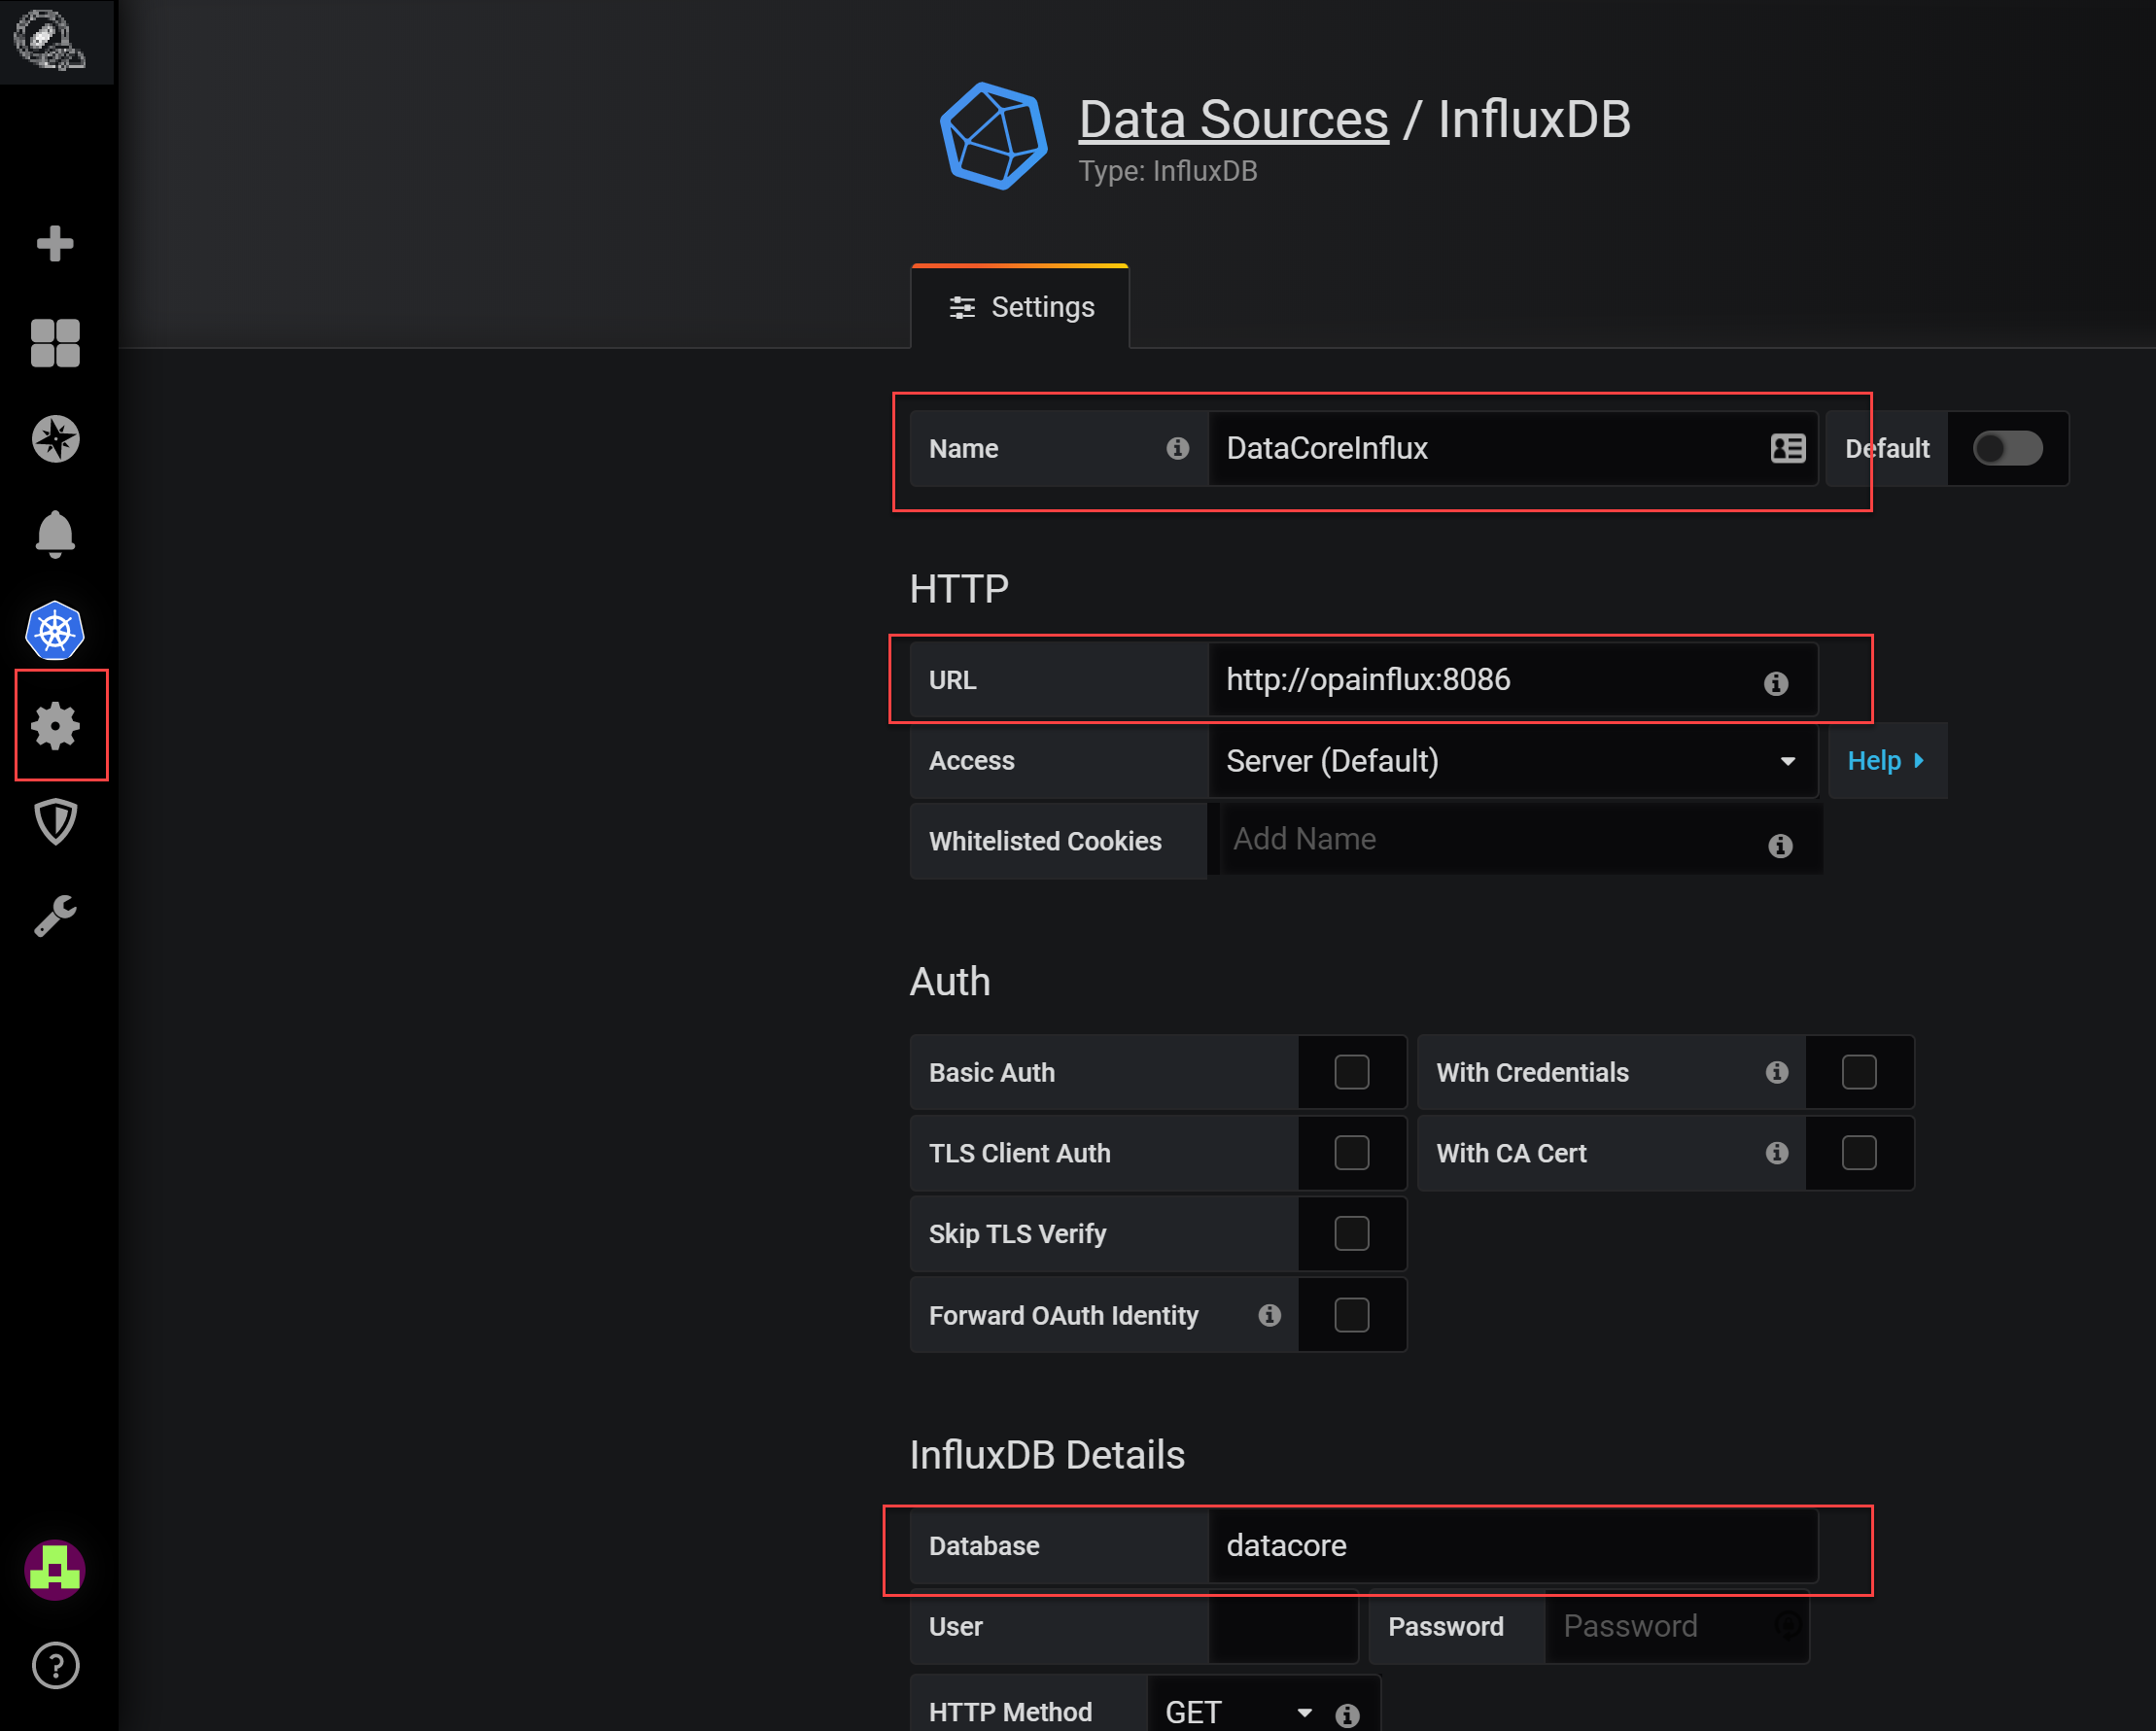
Click Save & Test.
Now, you need to import the DataCore Dashboard json file that can be found here:
https://opvizor-perfanalyzer.s3-eu-west-1.amazonaws.com/Datacore/DataCore+SANSymphony+Influx-1524149879665.json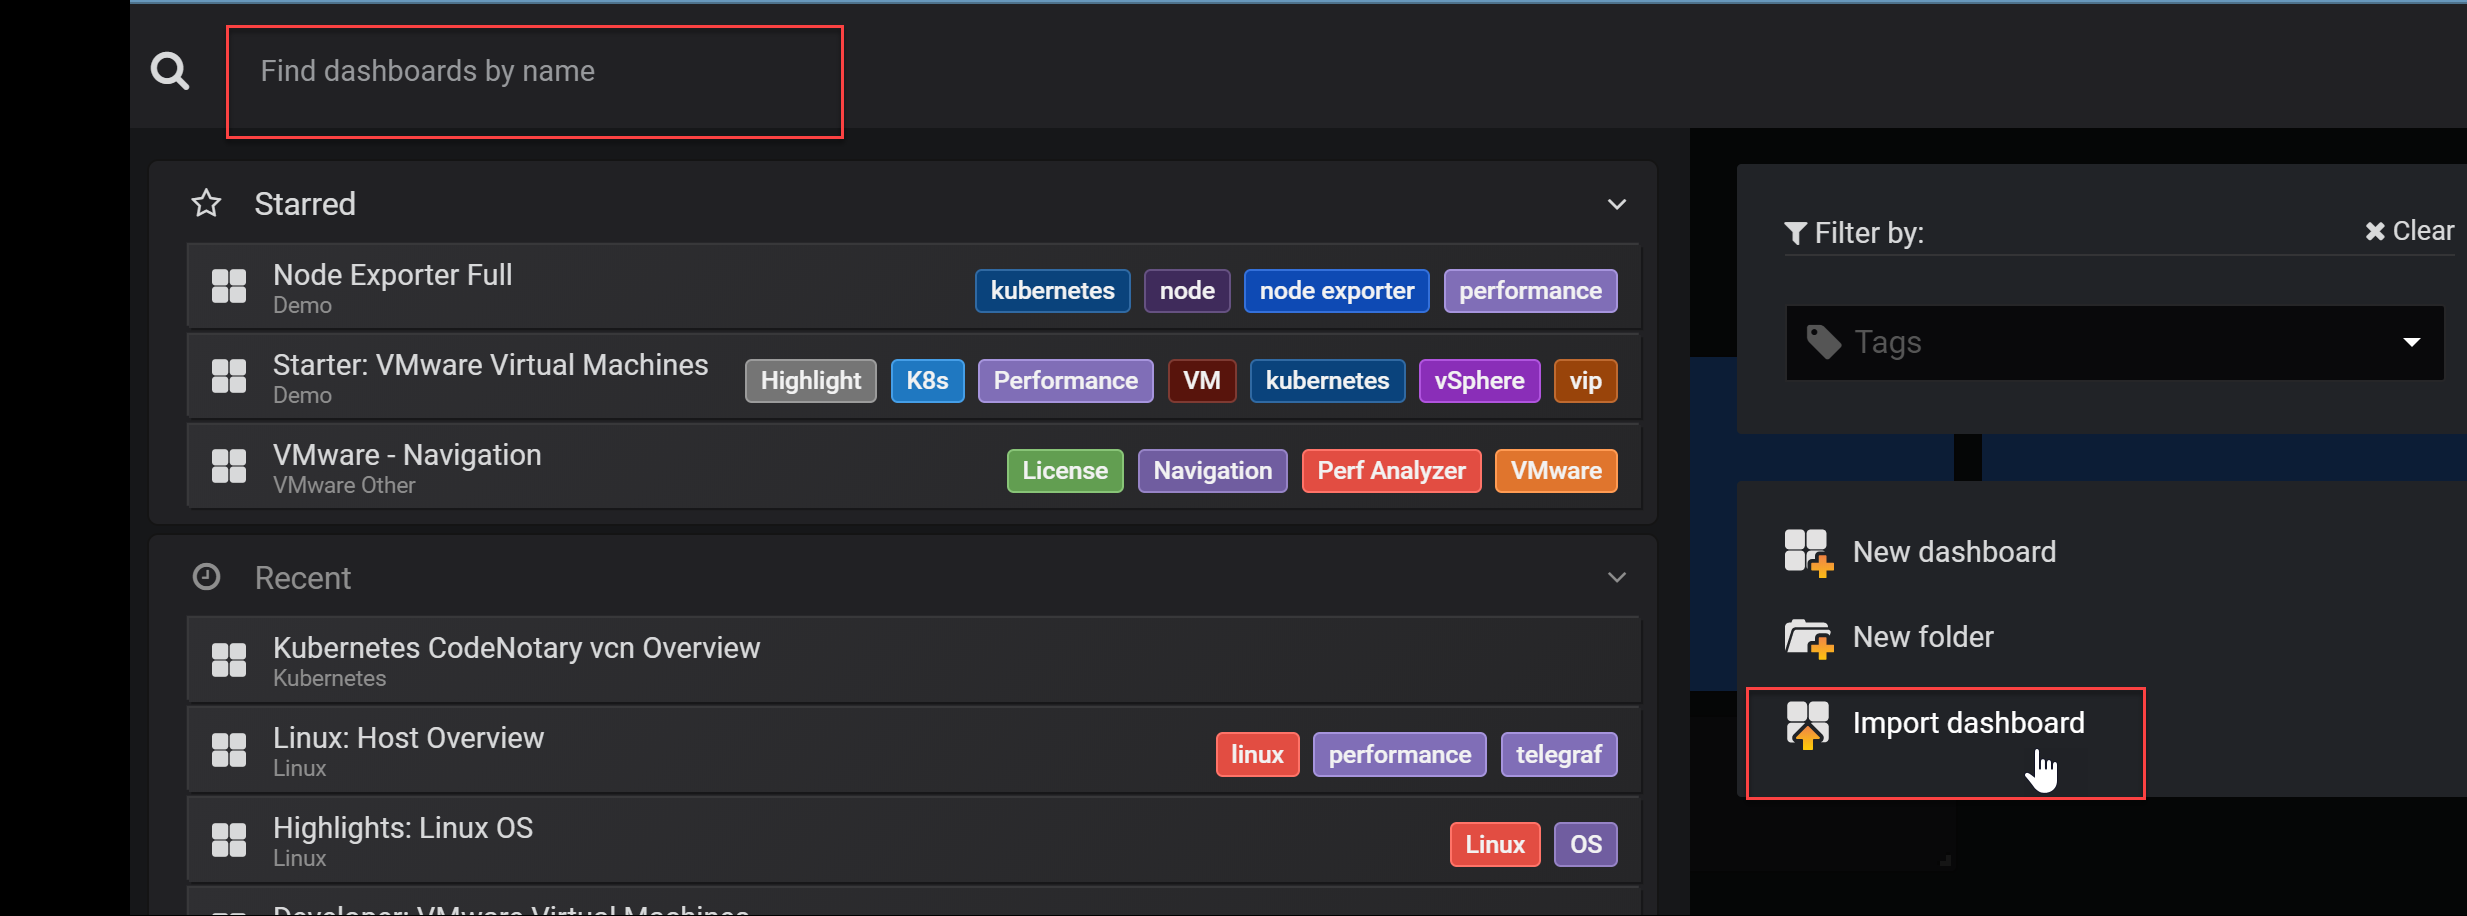
When importing the dashboard please select DataCoreInflux as the Influx datasource.
Summary
After a couple of minutes, you should see the first data within your DataCore SANSymphony Dashboard.
If you want to uninstall the service for any reason, you can do so by running telegraf –service uninstall within the installation directory as an administrator.