Metrics & Logs uses a similar global and local navigation layout to the Grafana open source project.

| Item | Name | Description |
|---|---|---|
| 1 | Additional Navigation |
Additional Navigation for key functions:
|
| 2 | Current Local Navigation |
The current left navigation item selected from the Additional Navigation button. |
| 3 | Add Panel | Add a new panel to the current dashboard |
| 4 | Favorites (Star) | Adds the current screen to your Favorites list. |
| 5 | Share Dashboard |
Shares the dashboard using a:
|
| 6 | Save Dashboard | Saves the dashboard settings (also CTRL + 5) |
| 7 | Manage Dashboard |
Allows you to manage a dashboard:
|
| 8 | Cycle View | Switch between different view options, including kiosk mode |
| 9 | Zoom out |
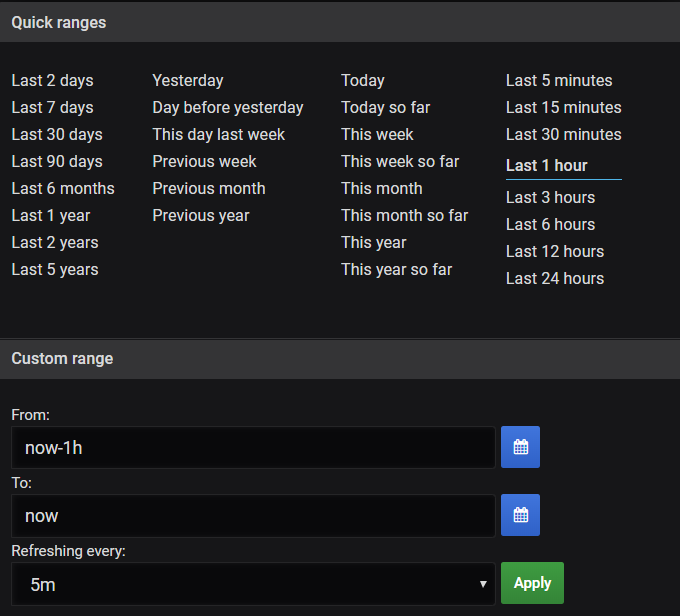
Allows you to adjust the time range and settings.You can also use CTRL + Z.
|
| 10 | Refresh data | Refreshes the data with current values. |
The left or local navigation is organized this way.

| Item | Name | Description |
|---|---|---|
| 1 | Home |
Takes you to the home dashboard |
| 2 | Add | Add new dashboards, Folder or import dashboards |
| 3 | Dashboards |
Takes you to an area to find your current dashboards as well as setting up new ones:
|
| 4 | Explore | Use the explore feature to troubleshoot performance |
| 5 | Alerts |
Allows you to set alerts:
|
| 6 | Configuration |
The main configuration menu
|
| 7 | Server Admin |
Manage:
|
| 8 | Appliance Settings |
The Metrics & Logs admin page
|
