Overall Metrics Flow
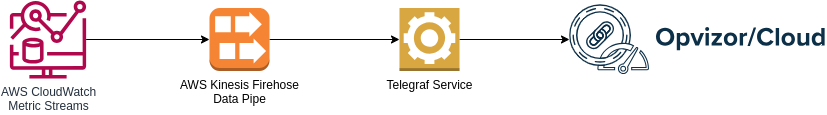
Steps
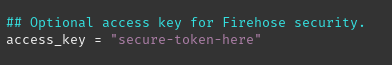
1. Setup Telegraf service with the provided telegraf.conf configuration from Opvizor/Cloud Integrations page.
Make sure to adjust the access_key for secure authentication from AWS Firehose.
Telegraf can be retrieved and installed with the following command lines
wget https://dl.influxdata.com/telegraf/releases/telegraf_1.26.3-1_amd64.deb sudo dpkg -i telegraf_1.26.3-1_amd64.deb_amd64.debsudo cp ./telegraf.conf /etc/telegraf/telegraf.confsudo systemctl enable telegraf
sudo systemctl restart telegraf
Watch our screen capture to ease your setup.
Note that AWS Kinesis Firehose data stream requires secure endpoint as destination therefore a valid TLS certificate must be set for the telegraf service.
Additionally it is not possible to point the AWS Kinesis Firehose to send metrics to a destination endpoint with port other than 443. To overcome this you can setup a port-forwarding using for example socat and enable it as a system service
[Unit]Description=Telegraf 443 to 2443 port forwarder
[Service]Type=simpleStandardOutput=syslogStandardError=syslogSyslogIdentifier=telegraf-forward
ExecStart=socat TCP-LISTEN:443,fork,reuseaddr TCP:127.0.0.1:2443Restart=always
[Install]WantedBy=multi-user.target
Copy/Paste the above service manifest to /etc/systemd/system/telegraf-forward.service
Then enable and start the service by executing the following command lines
sudo systemctl enable telegraf-forward.servicesudo systemctl restart telegraf-forward.service
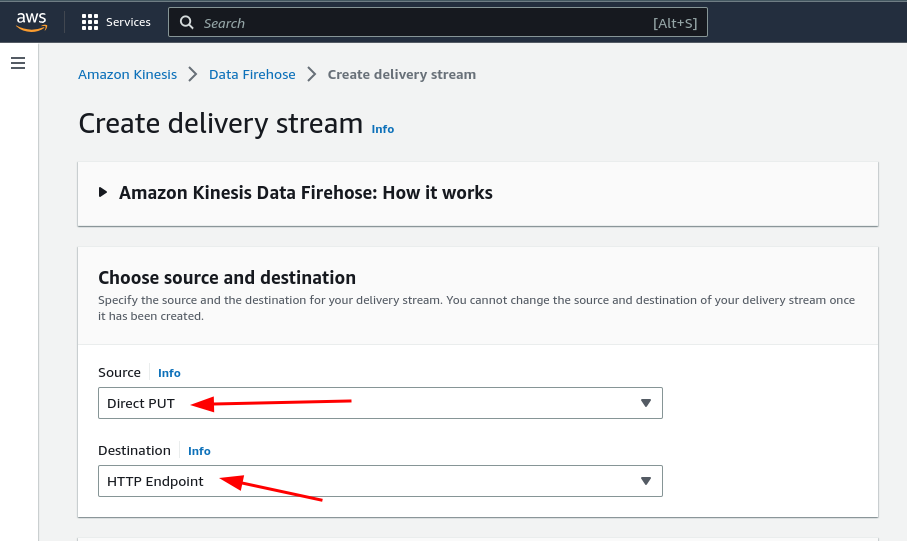
2. Setup AWS Kinesis Firehose
Set the source and destination type for the data pipe
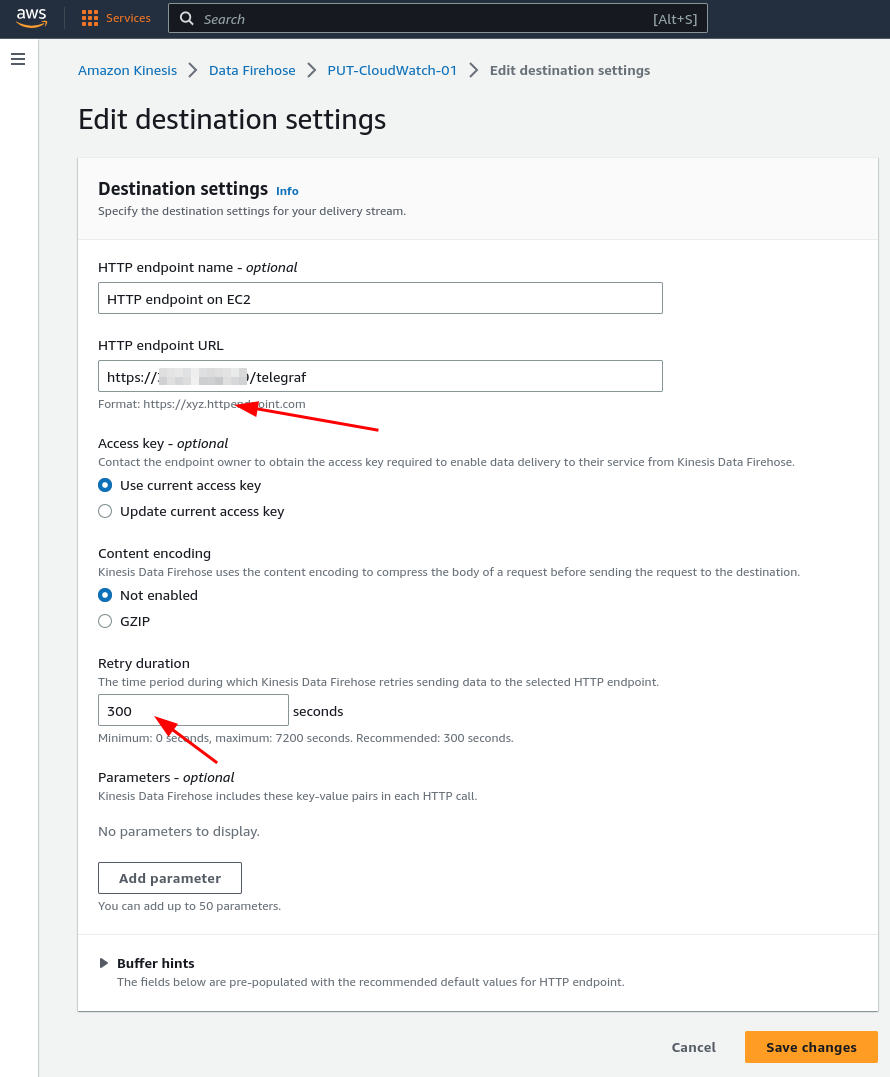
Adjust the destination settings
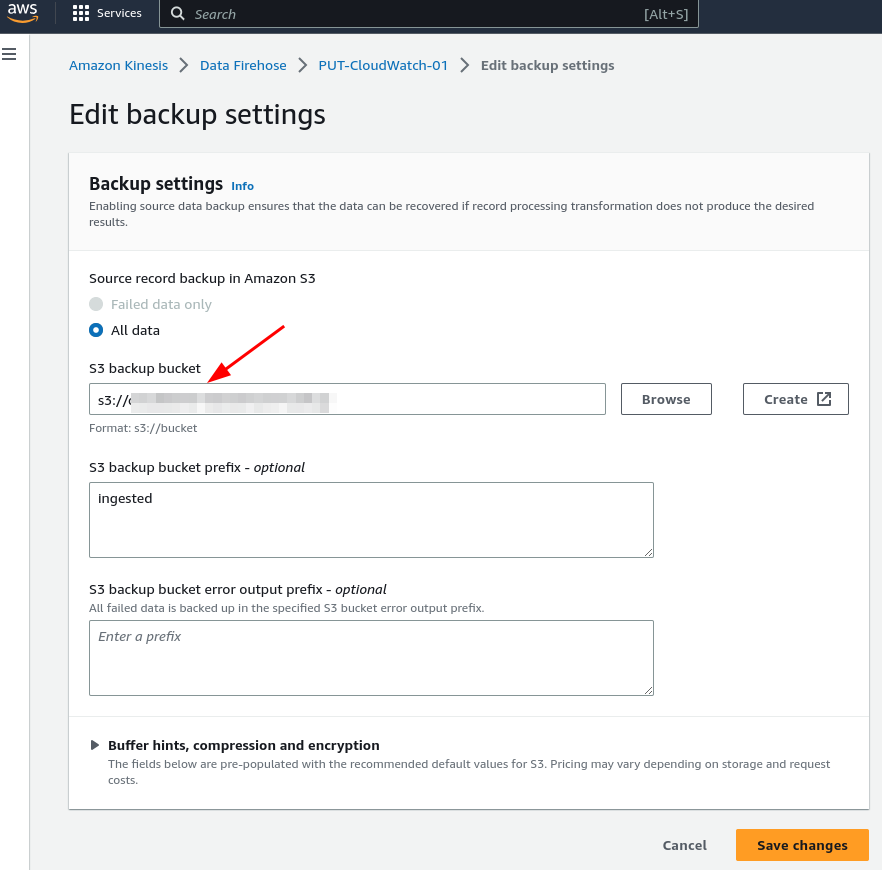
Additionally you might want to setup the backup of your metrics to s3
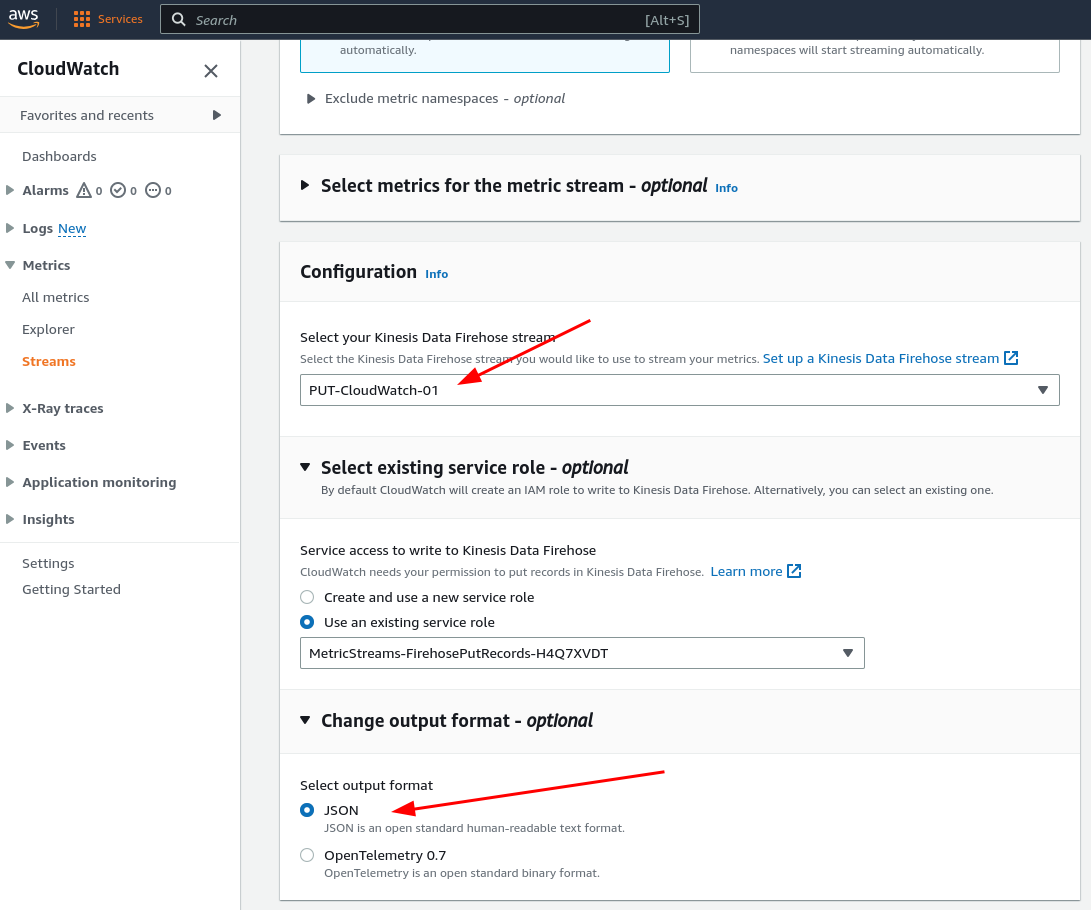
3. Enable CloudWatch Metric Streams
We recommend enabling streams for all available metrics however it is always up to you to choose what metric namespaces are selected.
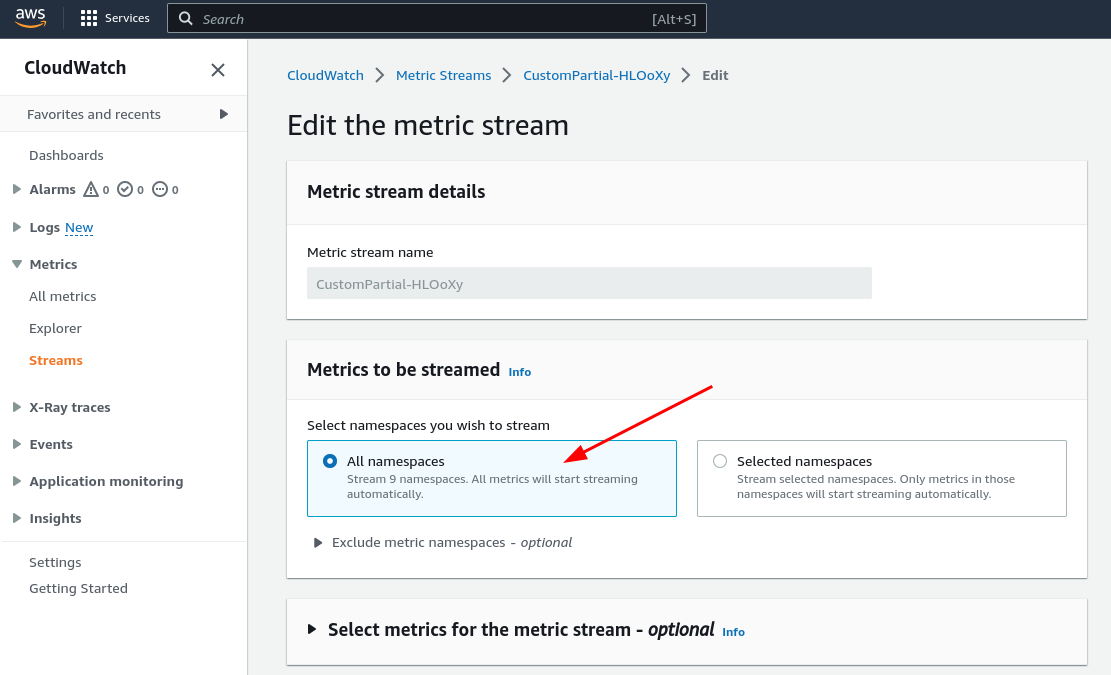
Finally choose the AWS Firehose data pipe as destination and set format of metrics to JSON.
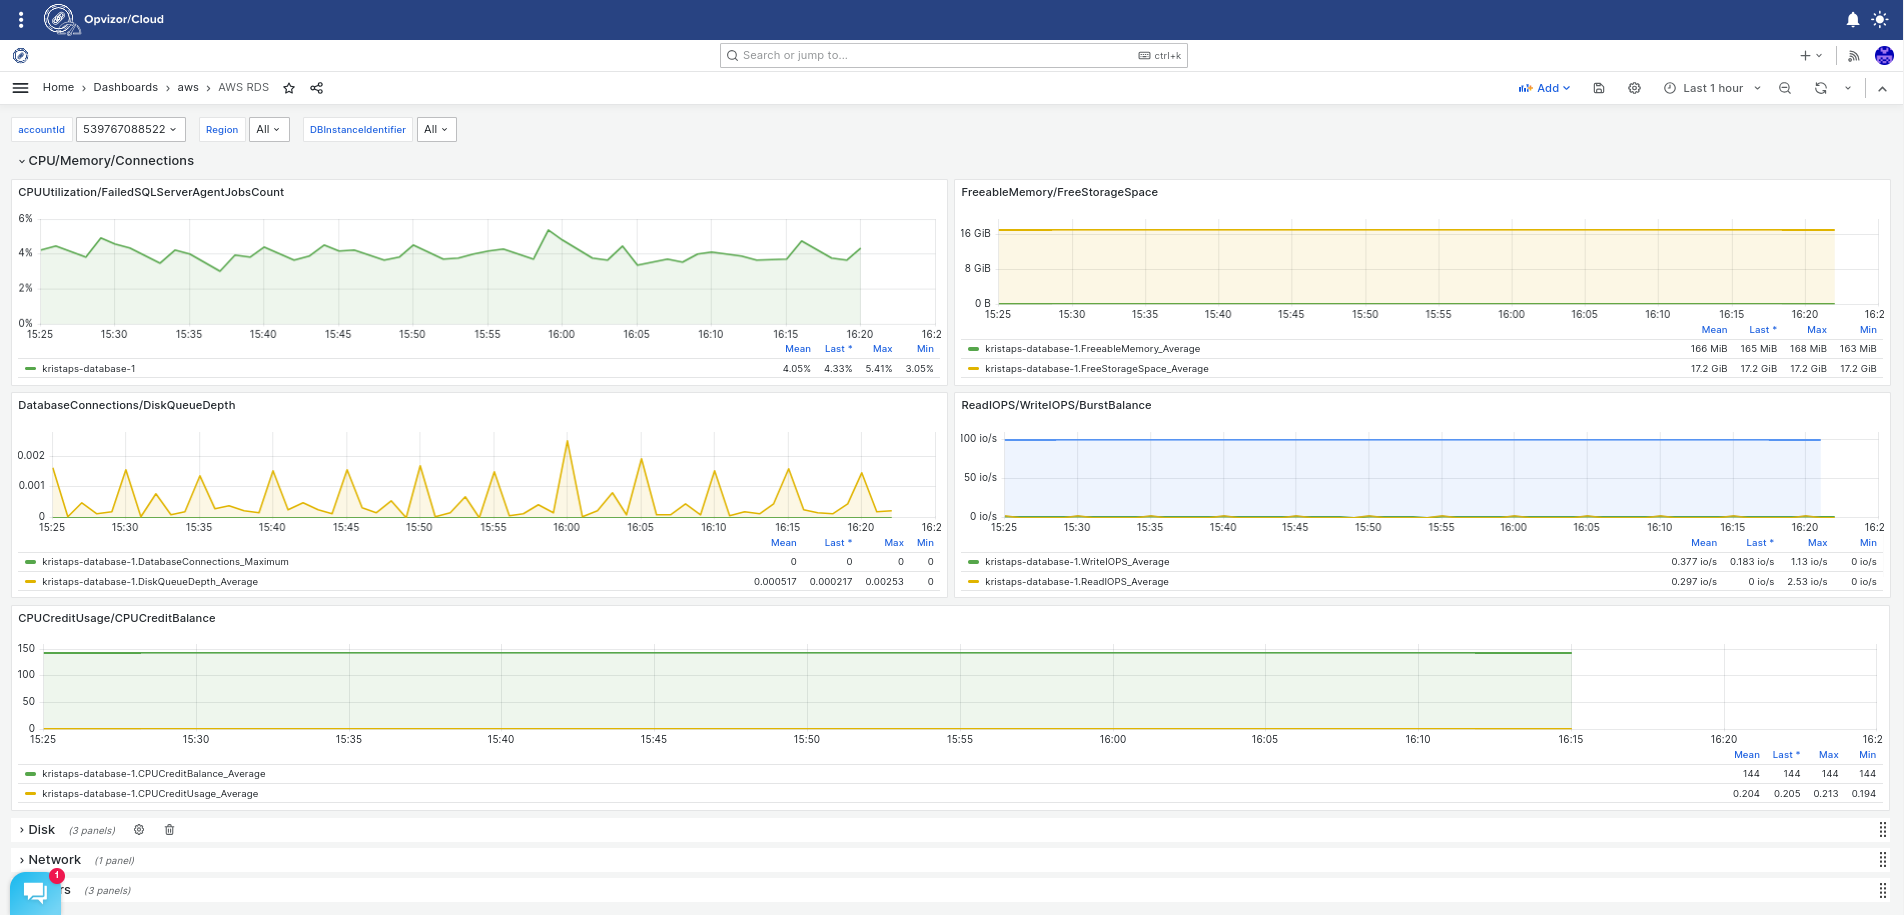
Browsing the Metrics
Once your are done with the configuration allow it to run for 5 - 10 minutes. Then you can start to look at the AWS dashboards.
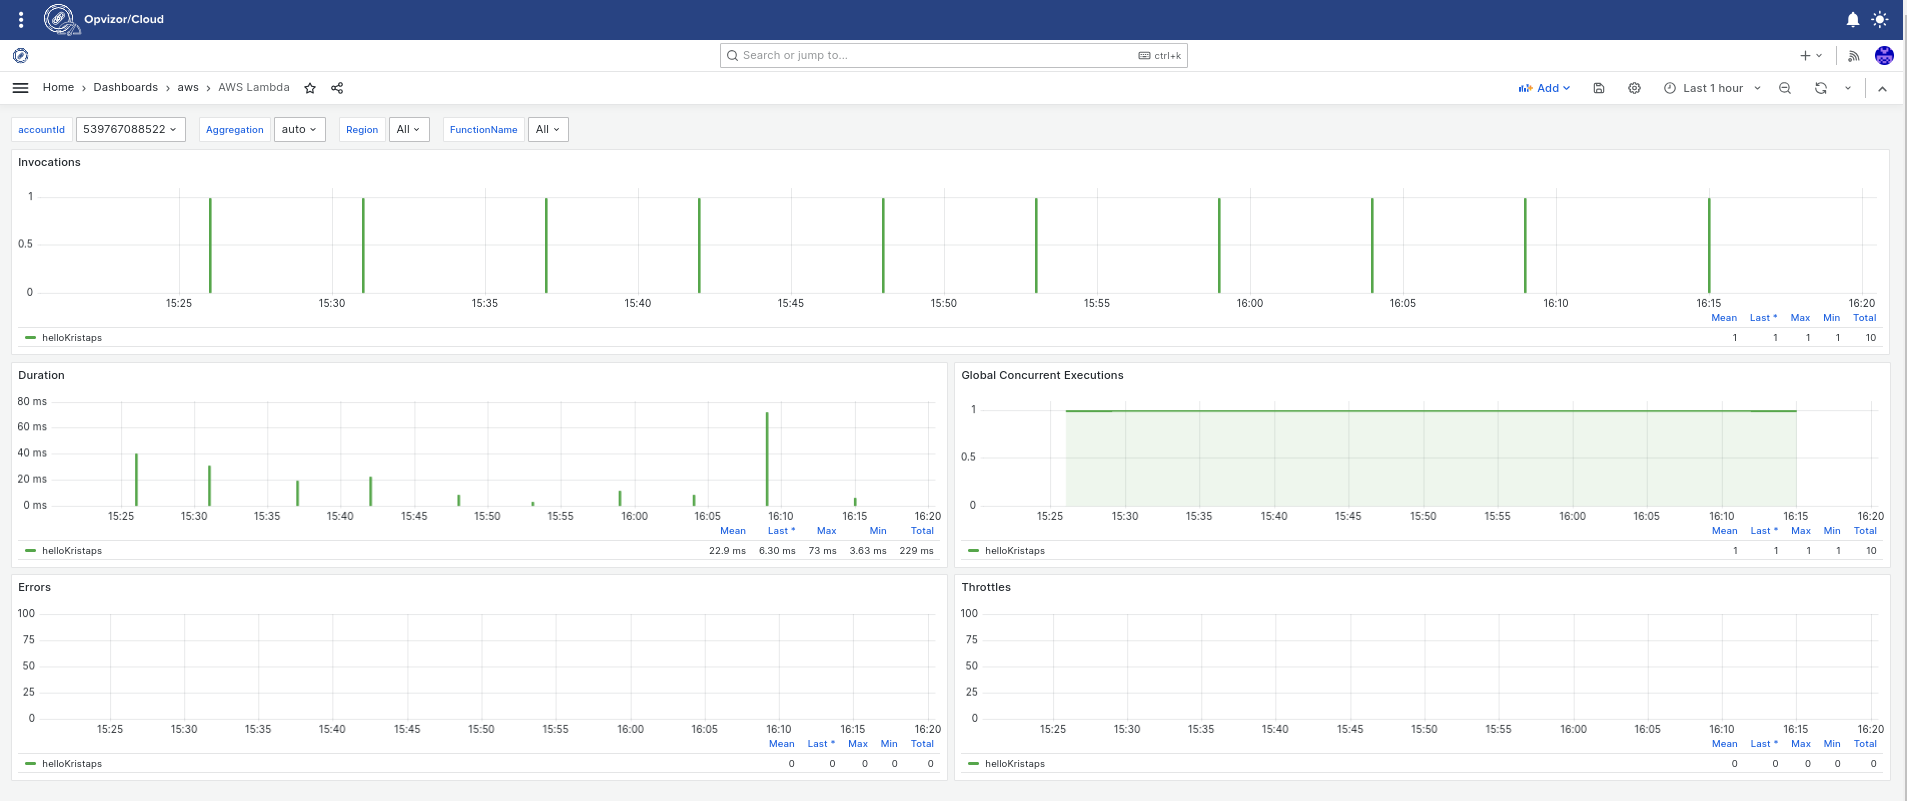
AWS Lambda
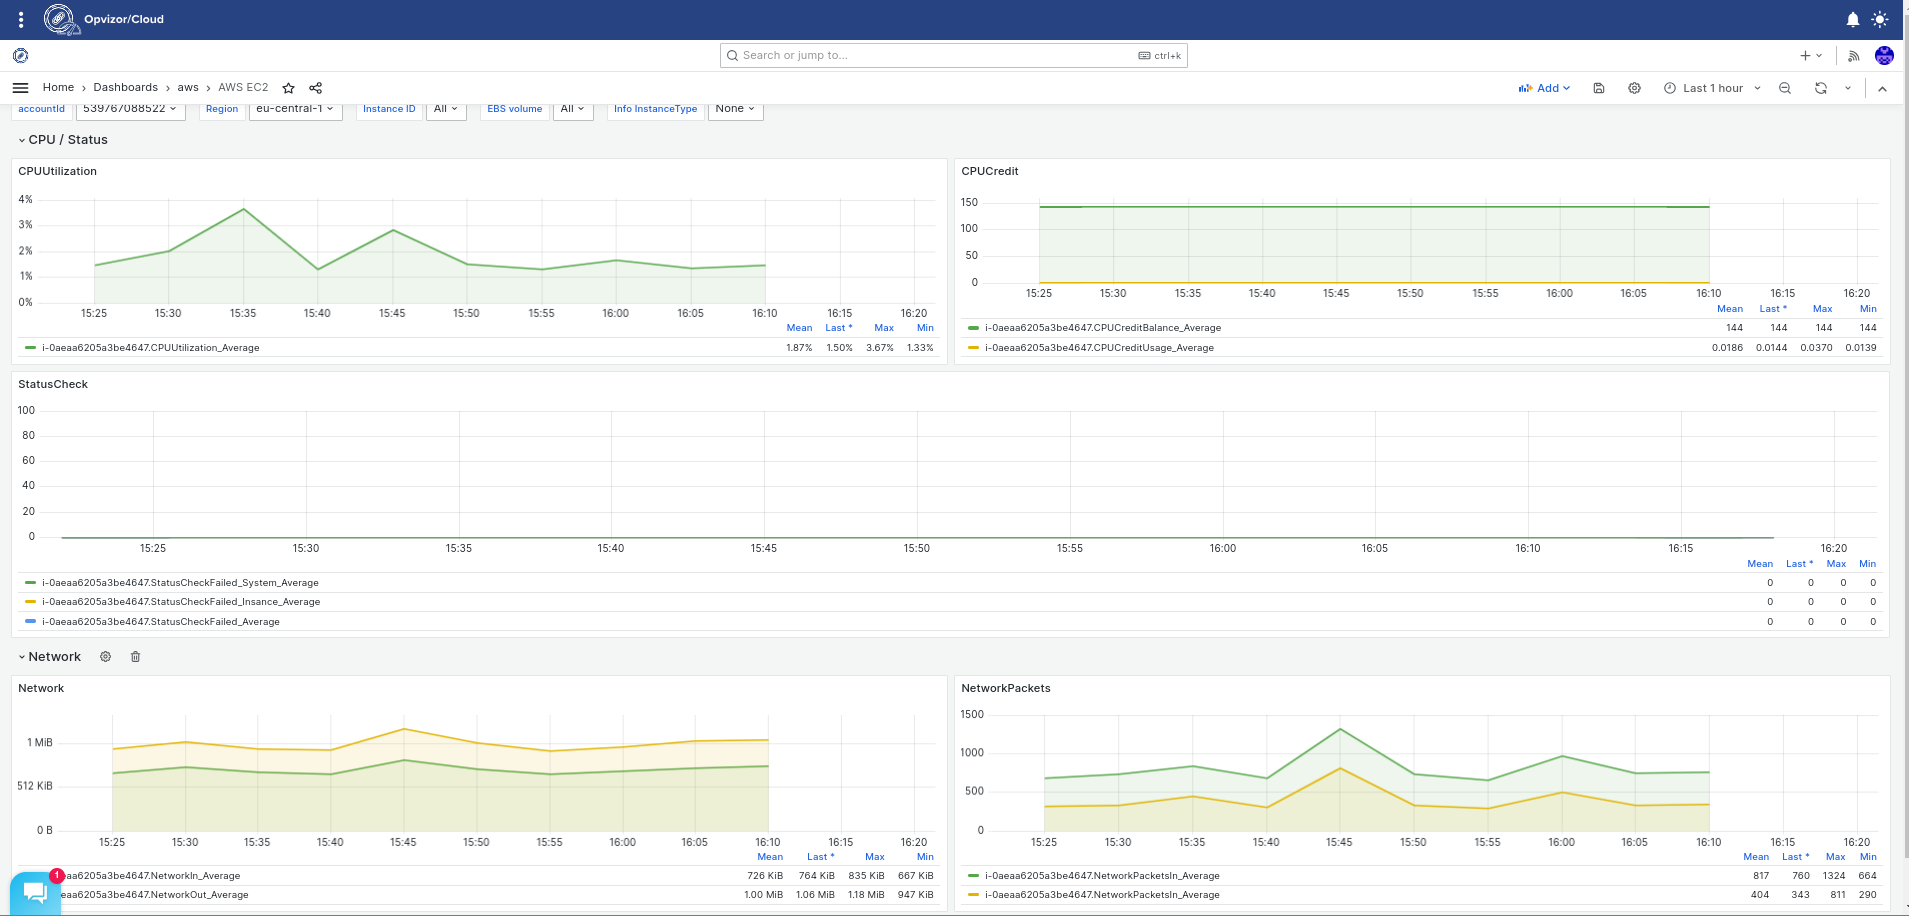
AWS EC2
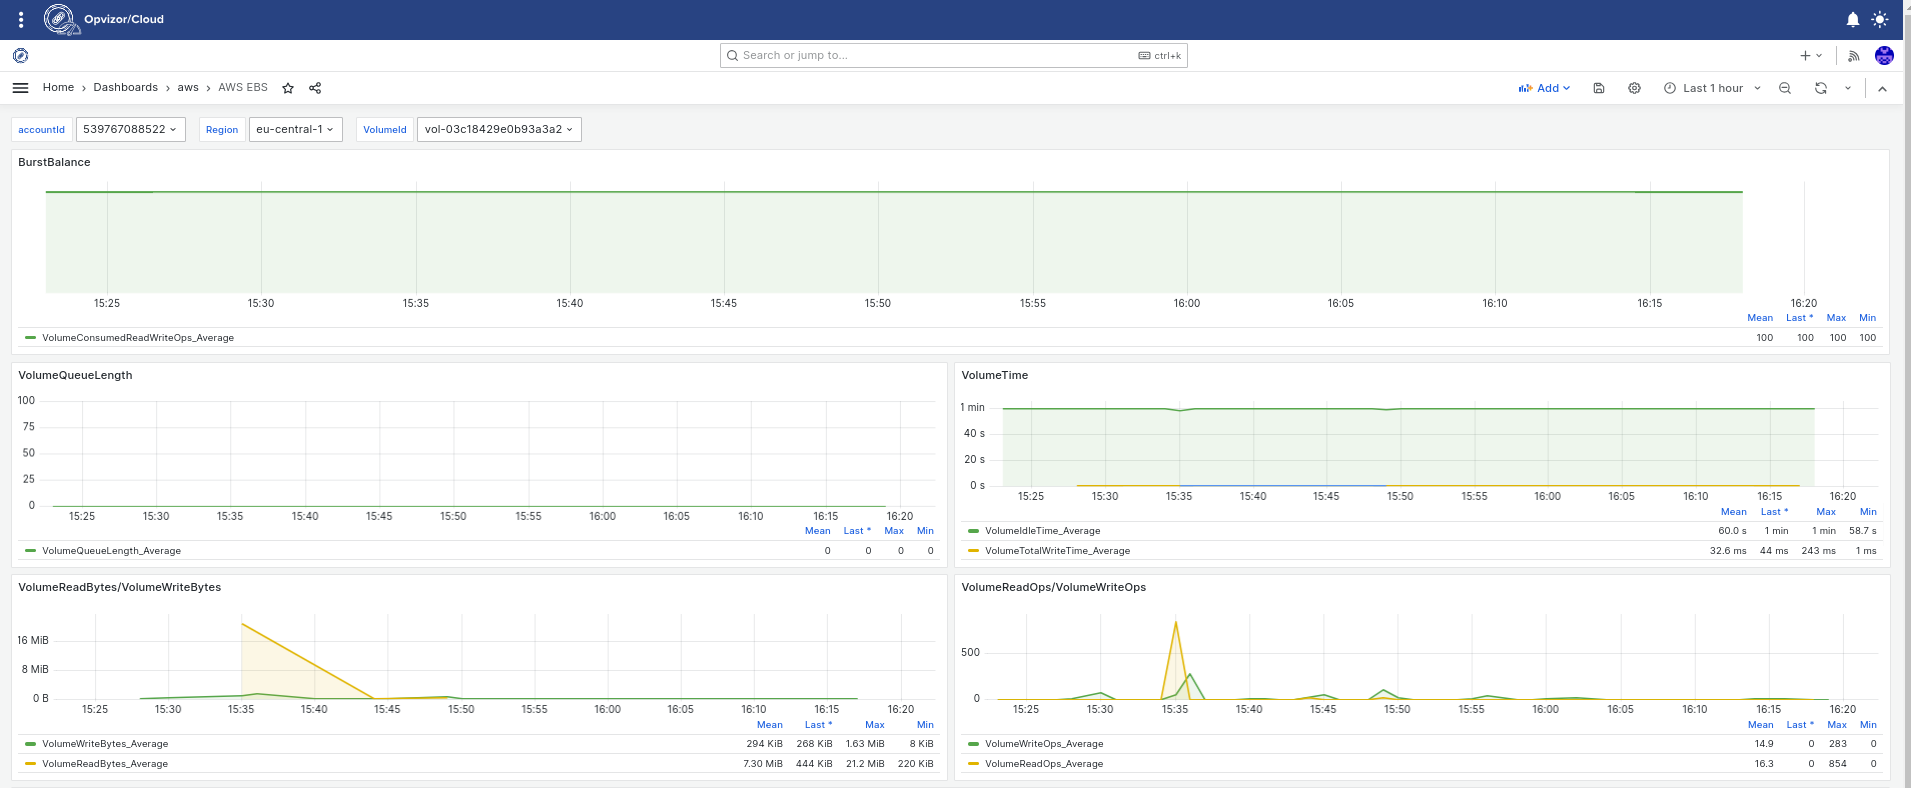
AWS EBS
AWS RDS