Telegraf can be retrieved and downloaded from the official release page based on your system and environment.
On a Linux system it usually installs under /etc/telegraf and the main configuration file is /etc/telegraf/telegraf.conf
To enable relay functionality and to forward data from your local telegraf instance adjust the configuration in /etc/telegraf/telegraf.conf based on the following steps.
Linux Example: Locate and change
[[outputs.http]]
  url = "https://sink.opvizor.com"
  data_format = "graphite"
  graphite_tag_support = true
  prefix = "opvagent" # or winagent for Windows
  [outputs.http.headers]
    X-API-KEY = "<your Opvizor/Cloud API key>"
to
[[outputs.graphite]]
  servers = ["192.168.100.11:2005"]
  prefix = "opvagent" # or winagent for Windows
  graphite_tag_support = true
!!! Note that the IP has to be adjusted to match with the one for your Cloud Connector instance.
Also important to change the prefix depending on the data you want to ship, i. e. Windows is prefix = "winagent"
Here's an example of complete Telegraf configuration forwarding the Linux integration to the Cloud Connector instance
# Global tags can be specified here in key="value" format.
[global_tags]
  # dc = "us-east-1" # will tag all metrics with dc=us-east-1
  # rack = "1a"
  ## Environment variables can be used as tags, and throughout the config file
  # user = "$USER"


# Configuration for telegraf agent
[agent]
  interval = "60s"
  round_interval = true
  metric_batch_size = 1000
  metric_buffer_limit = 10000
  collection_jitter = "0s"
  flush_interval = "10s"
  flush_jitter = "0s"
  precision = ""
  debug = false
  quiet = false
  logfile_rotation_max_size = "20MB"
  logfile_rotation_max_archives = 5
  hostname = ""
  omit_hostname = false


### OUTPUT

# Configuration for influxdb server to send metrics to
[[outputs.graphite]]
  servers = ["192.168.100.11:2005"]
  prefix = "opvagent"
  graphite_tag_support = true

# Read metrics about cpu usage
[[inputs.cpu]]
  ## Whether to report per-cpu stats or not
  percpu = true
  ## Whether to report total system cpu stats or not
  totalcpu = true
  ## Comment this line if you want the raw CPU time metrics
  fielddrop = ["time_*"]


# Read metrics about disk usage by mount point
[[inputs.disk]]
  ## By default, telegraf gather stats for all mountpoints.
  ## Setting mountpoints will restrict the stats to the specified mountpoints.
  # mount_points = ["/"]

  ## Ignore some mountpoints by filesystem type. For example (dev)tmpfs (usually
  ## present on /run, /var/run, /dev/shm or /dev).
  ignore_fs = ["tmpfs", "devtmpfs"]


# Read metrics about disk IO by device
[[inputs.diskio]]
  ## By default, telegraf will gather stats for all devices including
  ## disk partitions.
  ## Setting devices will restrict the stats to the specified devices.
  devices = ["sd*", "hd*", "nvme*", "mdadm*", "md*"]
  ## Uncomment the following line if you need disk serial numbers.
  # skip_serial_number = false


# Get kernel statistics from /proc/stat
[[inputs.kernel]]
  # no configuration


# Read metrics about memory usage
[[inputs.mem]]
  # no configuration


# Get the number of processes and group them by status
[[inputs.processes]]
  # no configuration


# Read metrics about swap memory usage
[[inputs.swap]]
  # no configuration


# Read metrics about system load & uptime
[[inputs.system]]
  # no configuration

# Read metrics about network interface usage
[[inputs.net]]
  # collect data only about specific interfaces
  interfaces = ["eth*", "en*", "wla*"]


[[inputs.netstat]]
  # no configuration

[[inputs.interrupts]]
  # no configuration

[[inputs.linux_sysctl_fs]]
  # no configuration
Make sure that you've restarted the Telegraf agent after you've made the changes. The data should flow within a minute or two.
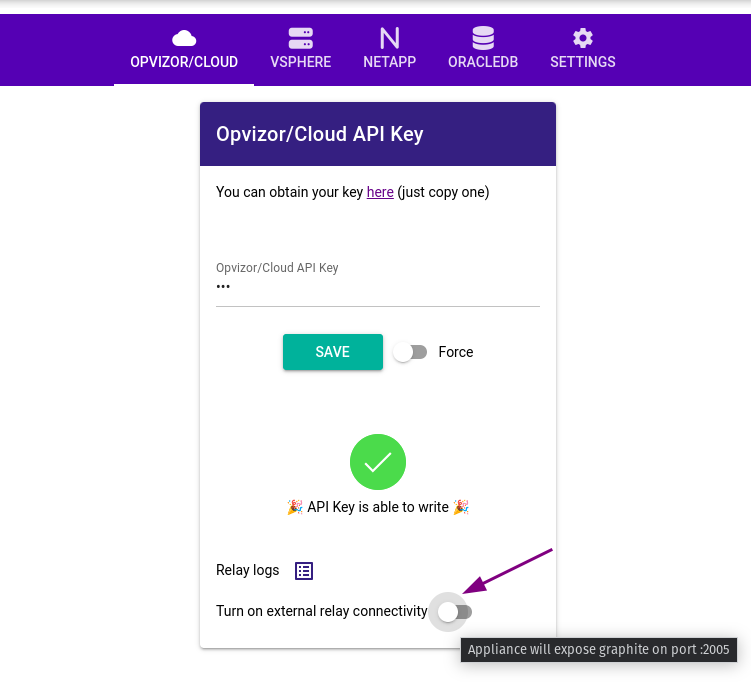
Finally enable the relay receiver on the Cloud Connector by toggle switch.