General information
To simplify the installation, we decided to deliver the Opvizor Metrics & Logs as a prepackaged virtual appliance. So there are just a few steps to do to get the virtual appliance up and running.
Provisioning - step by step
The Metrics & Logs product is supplied as a VMware OVF template. To install:
- Register to get the virtual appliance download link: https://opvizor.com/trial
- Extract the ZIP file, e.g. with Windows Explorer.
- Import the appliance using your VMware vCenter. Use the function “Deploy OVF Template” or “Deploy OVF template”. That import can take several minutes depending on your environment.
- If you use the vSphere Web client, it can happen that this function is not available until you install the Client package. Then you can access the vSphere client (aka Fat-Client). During the deployment, you can set the storage for the appliance.
- If your infrastructure has more than 1000 virtual machines the use of SSD storage is recommended as continuously storing performance in real-time is very IO-intensive.
- If you are running 1000 VMs or more, you should also consider doubling the amount of memory of the appliance.
- Start the appliance.
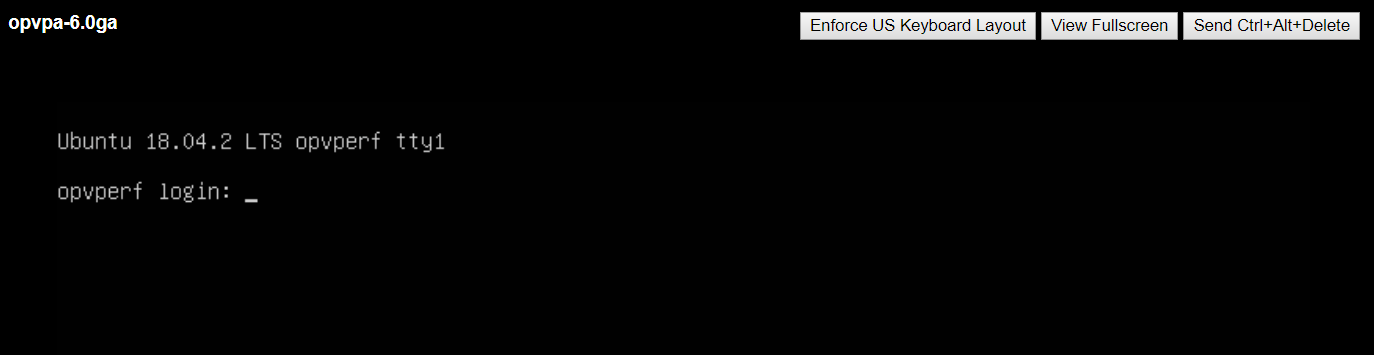
- Open the console.
- When the startup has completed, you will see the following screen and log in with the following credentials: Login: admin Password: VMware123
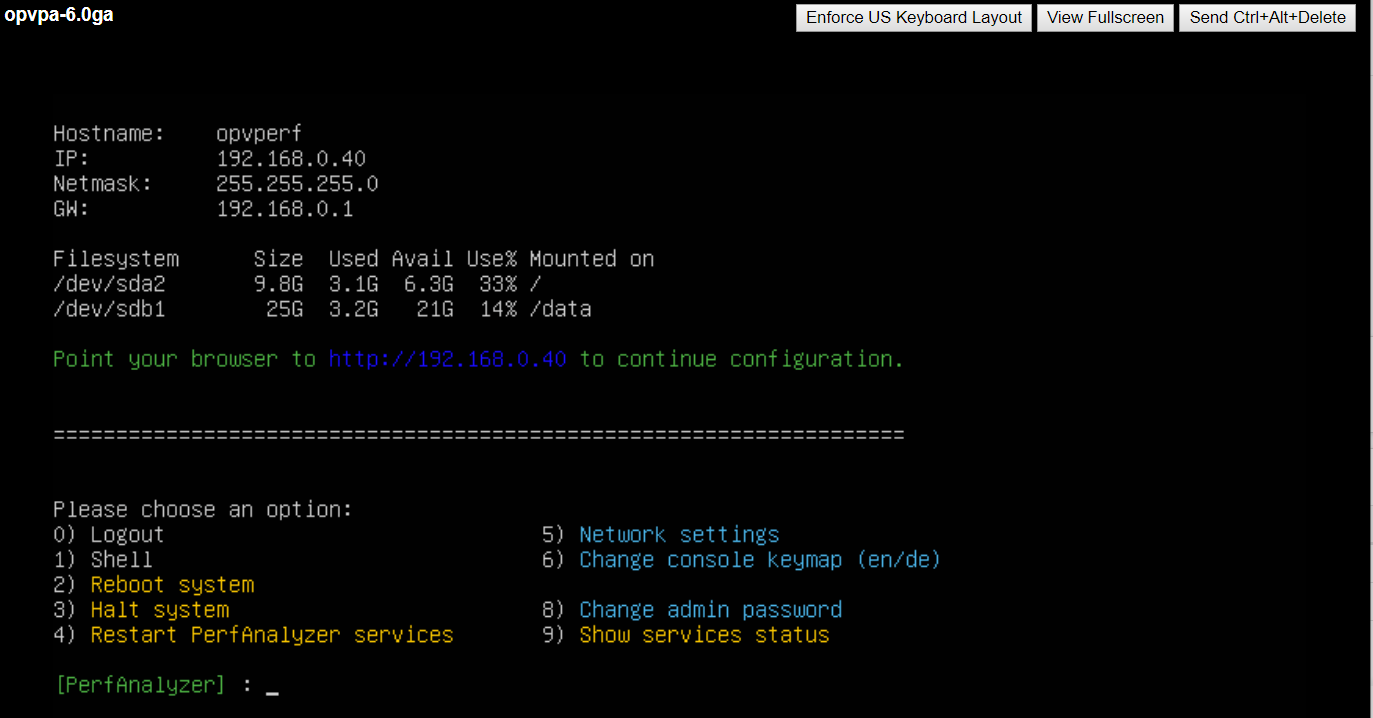
- After login the configuration main menu shows up: Choose the menu item 6, if you use a German keyboard (for confirmation “z” for “y”).
- Variant a): If you are using DHCP, just open the appliance ip in a browser
Variant b): If you want to use a static address, you have to use menu item 5. When completing this menu, a demo license creates automatically and the appliance restarts. - After about one minute, the appliance should be back up. To collect and represent data from your VMware infrastructure the appliance has to connect to a VMware vCenter.
- Open the appliance configuration page under http://ip_or_systemname_appliance/admin in your browser.
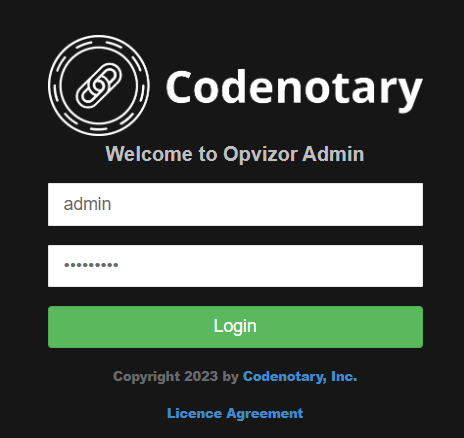
- To login, use the following data: User name: admin Password: VMware123 and press the login button.
The Overview page of the administration area appears.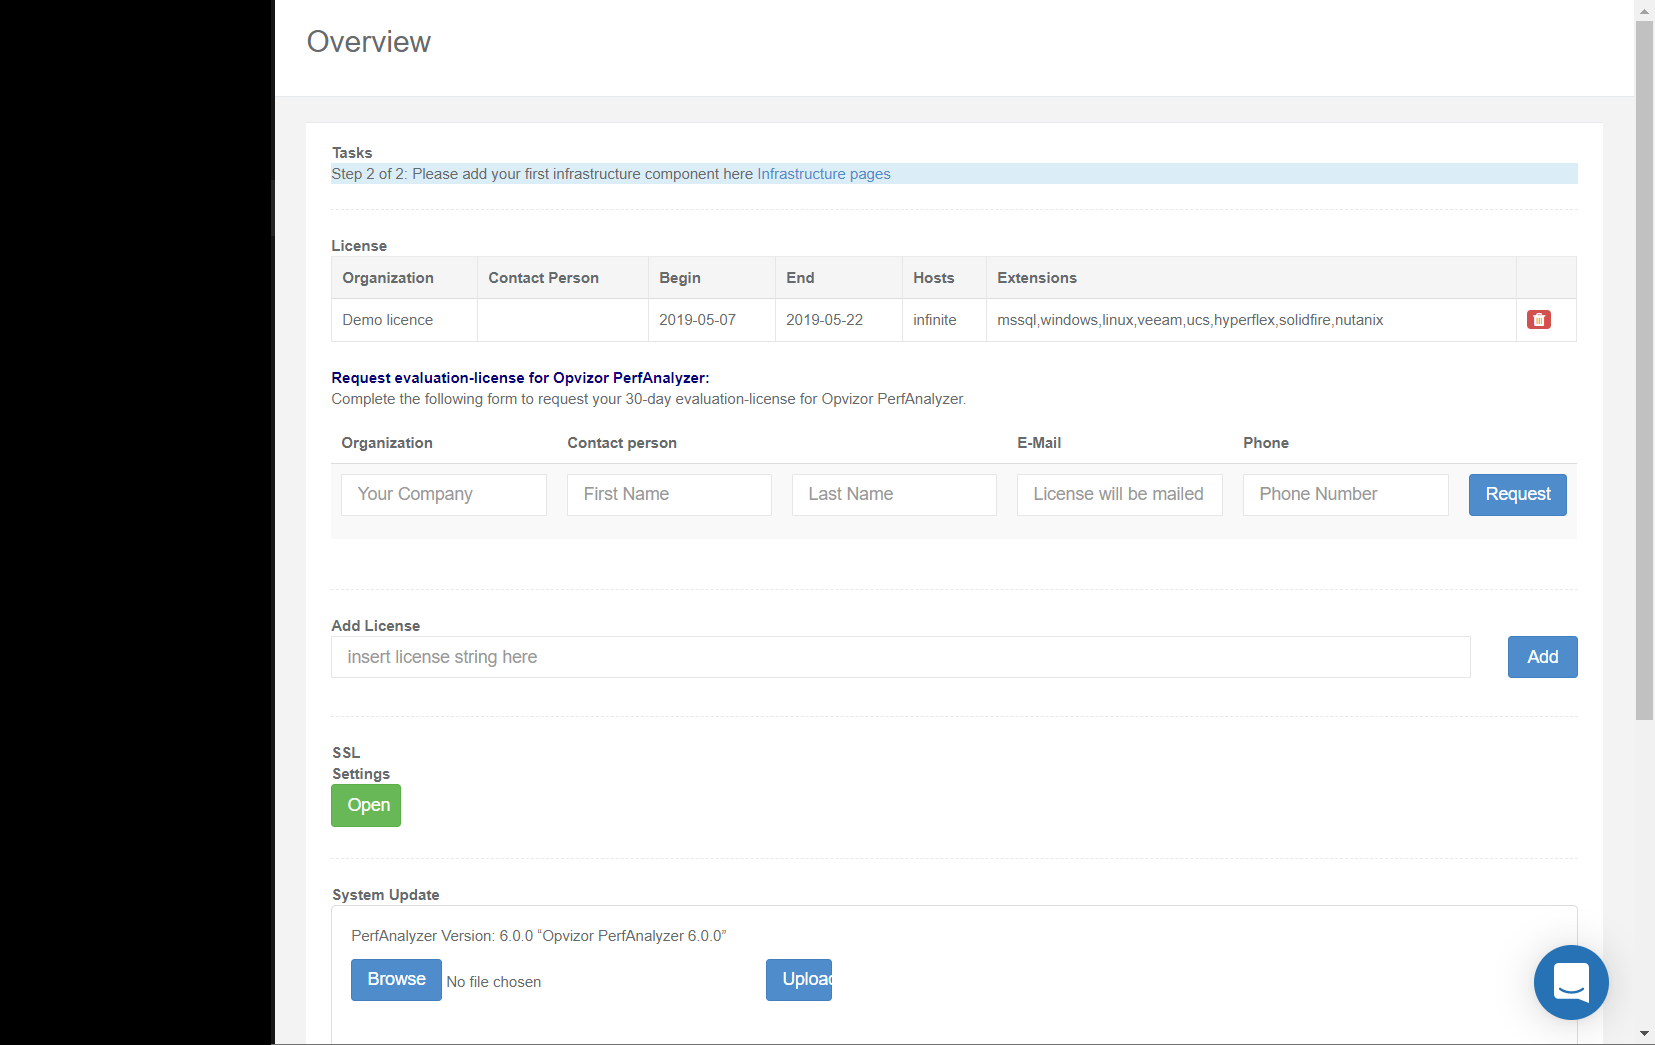
-
Click on Infrastructure >VMware >Add vCenter to indicate the vCenter and access data.
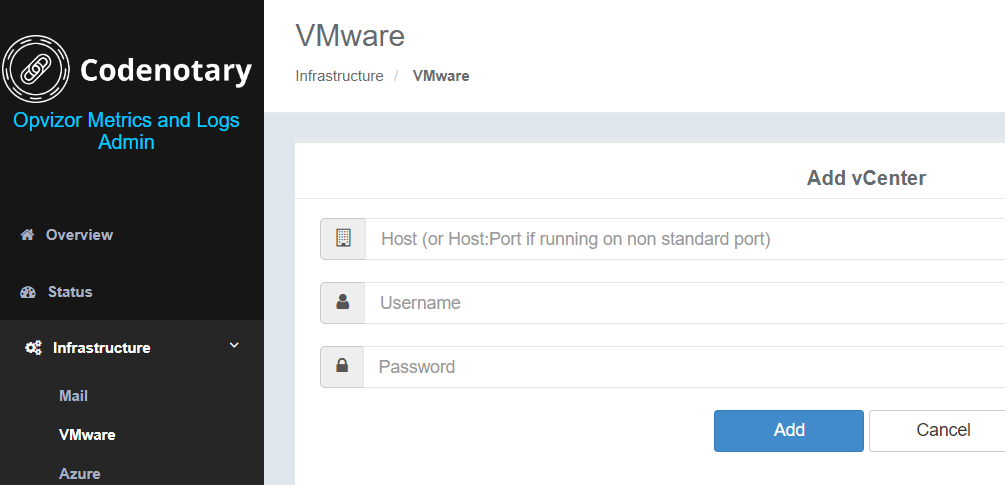
- Enter the credentials and click Add.
- Please wait about 10 minutes before checking the first dashboard results as data collection takes some minutes. You can use the Explore Dashboard Link in the navigation.
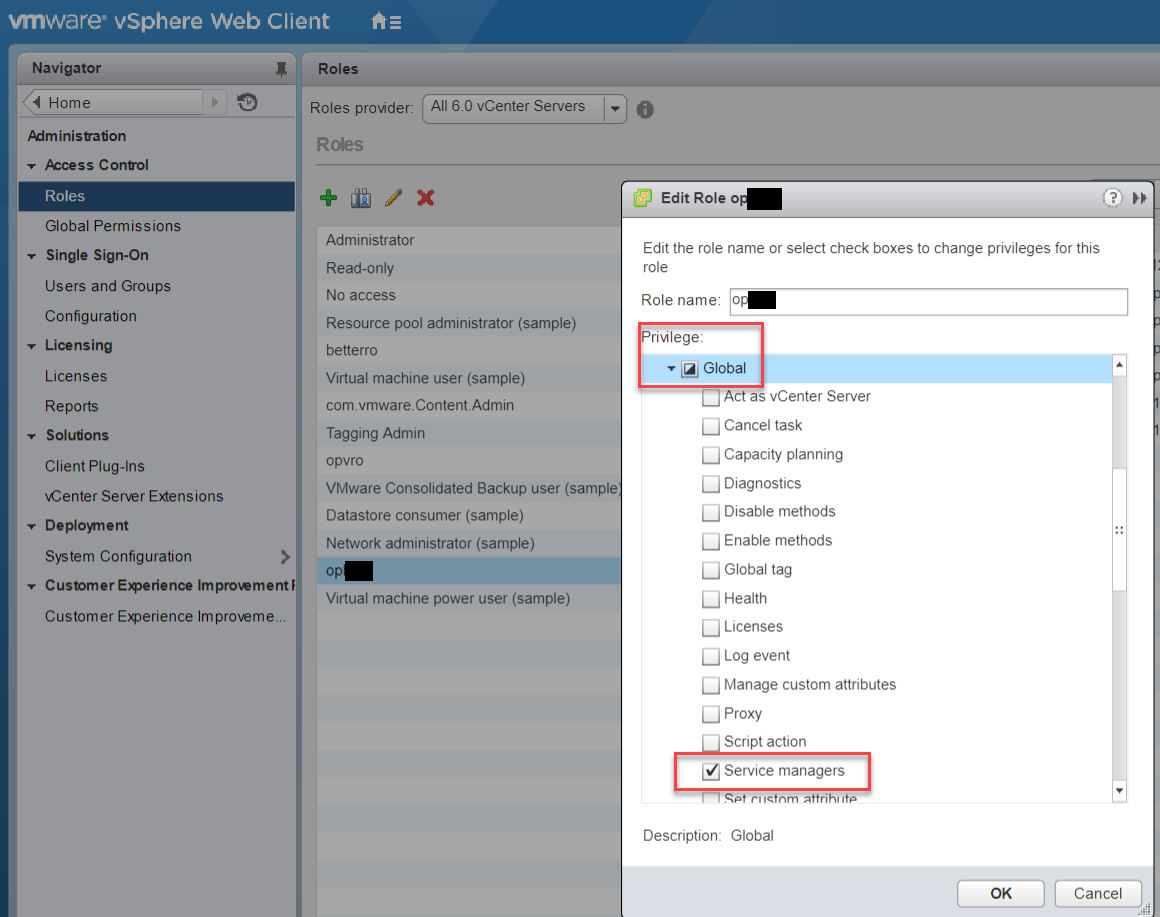
- Privileges: You can use a less privileged VMware user that has only read access and the Global - Service Manager permission (to enable NUMA data gathering)
 or
or 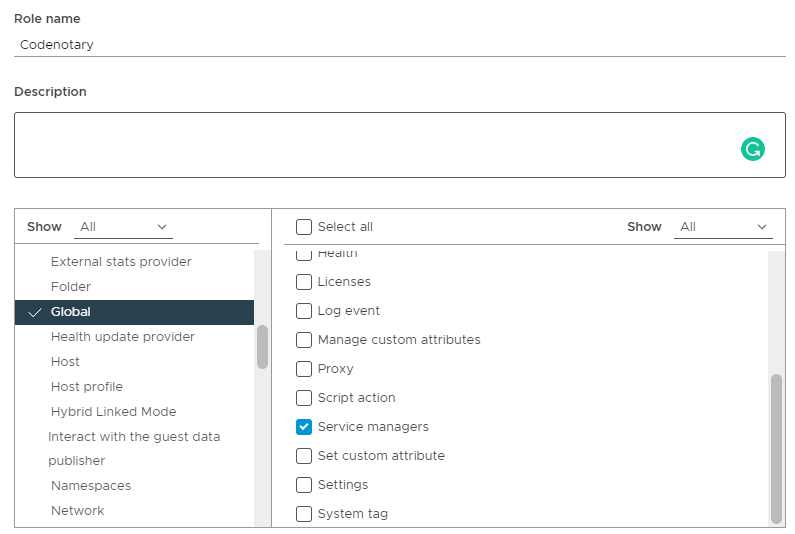
-
The credentials are automatically tested.
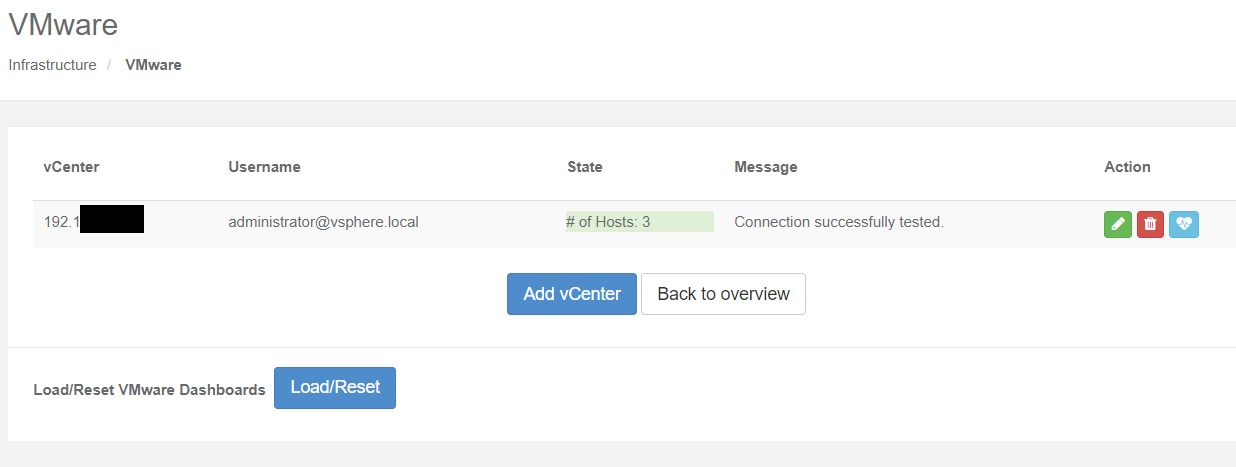
If the test was successful, the message “Connection successfully tested” shows up. - The opvizor Metrics & Logs is now successfully configured and begins collecting data. Depending on the size of your infrastructure, it may take approximately 5 to 15 minutes until you see results.
- Now press the Log-out in the left menu.
Enable HTTPS
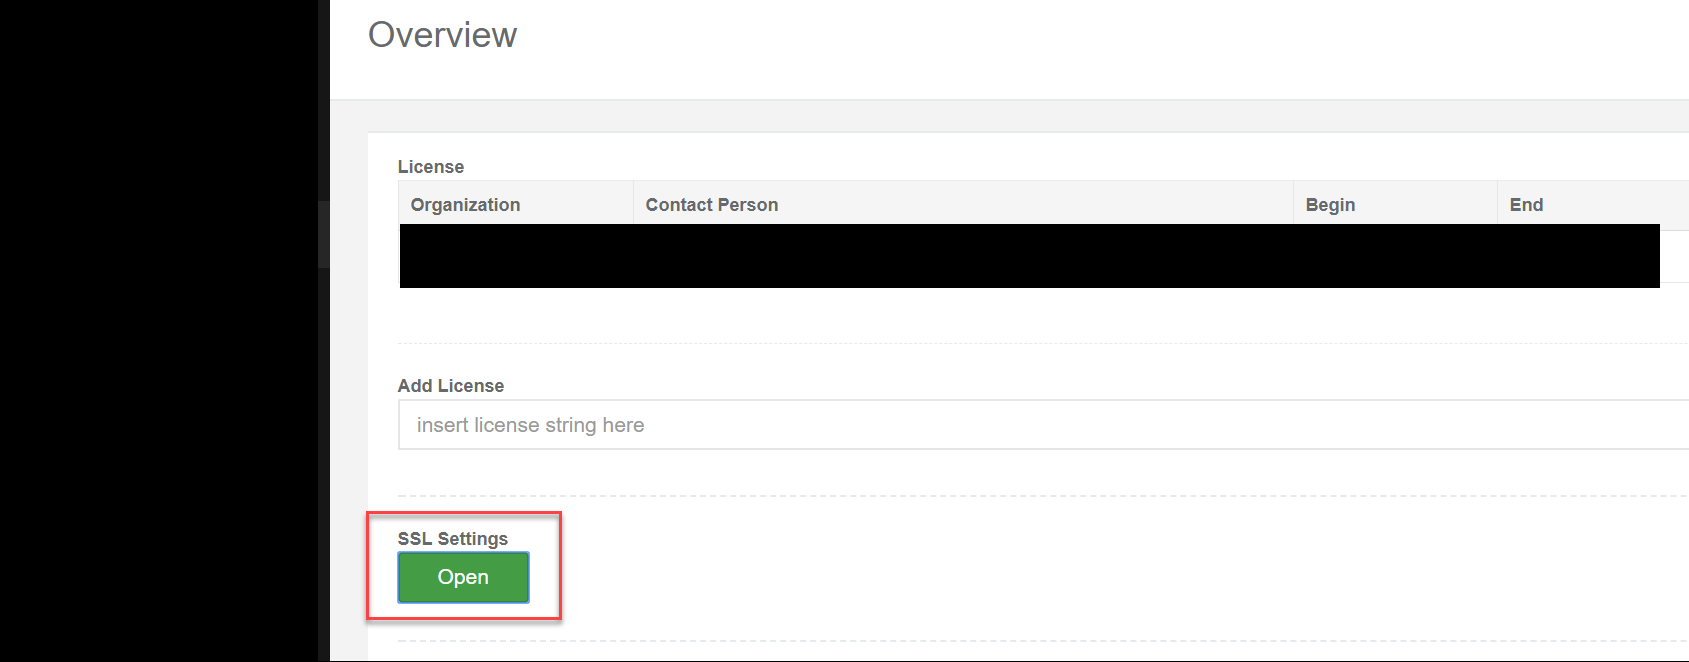
We made it pretty straightforward to enable HTTPS (SSL) to access the appliance. Within the Admin interface / Overview click the Open Button under SSL settings:
Then either use the integrated SSL Certificate or upload your own PEM formatted certificate. Detailed information to create your own CSR
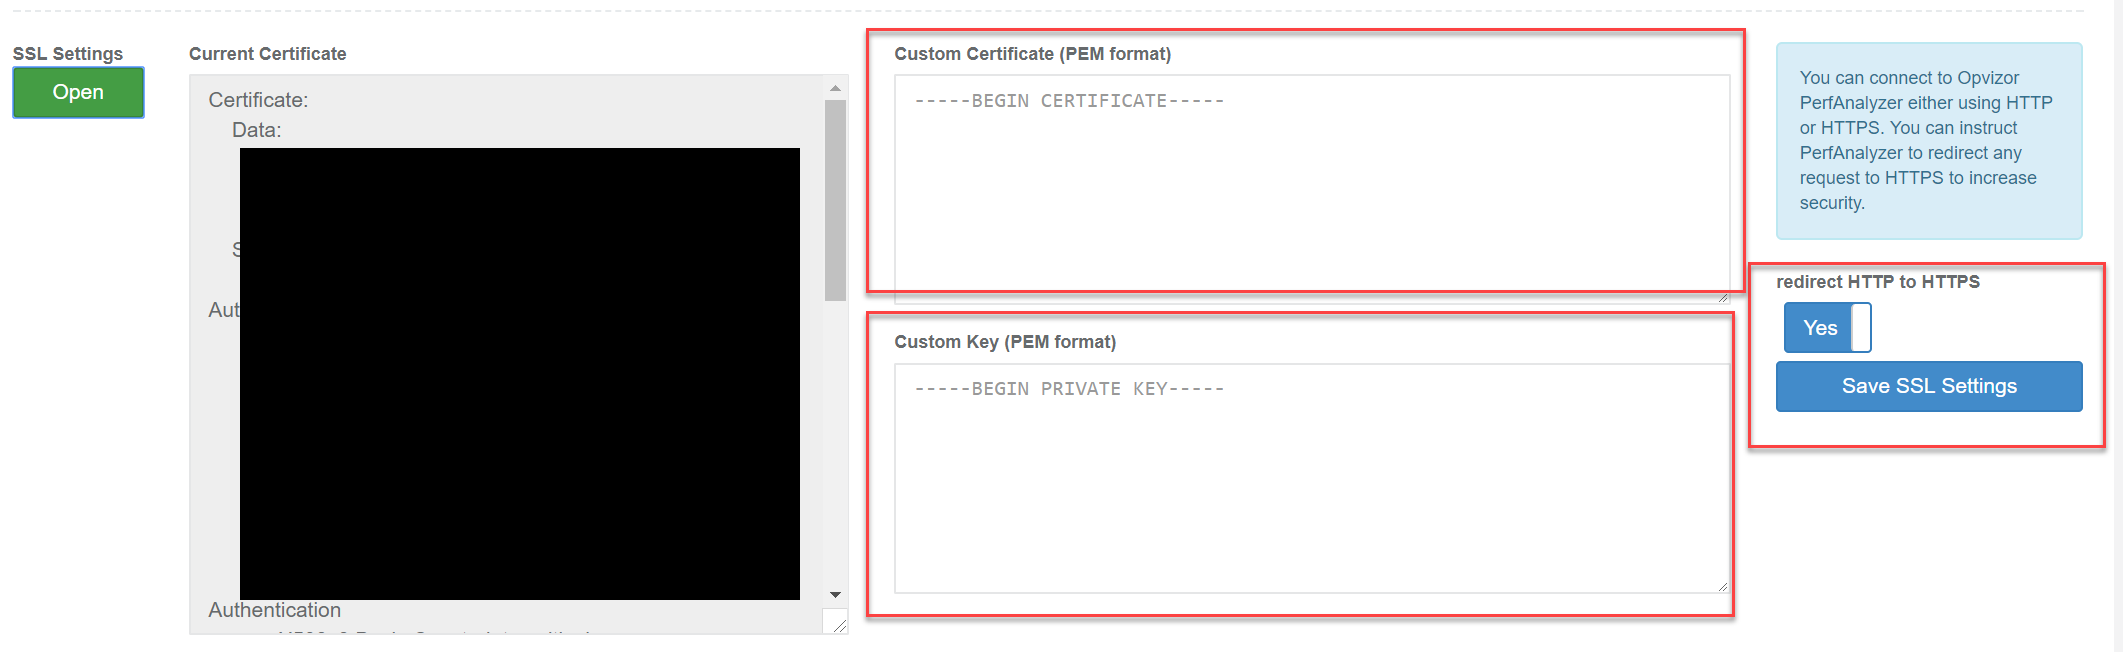
You can save the SSL Settings and decide to redirect all HTTP connections to HTTPS as well.
VMware vSphere Settings
Please make sure that you have a 5 minute statistics level of 2 configured for your VMware vCenter systems:
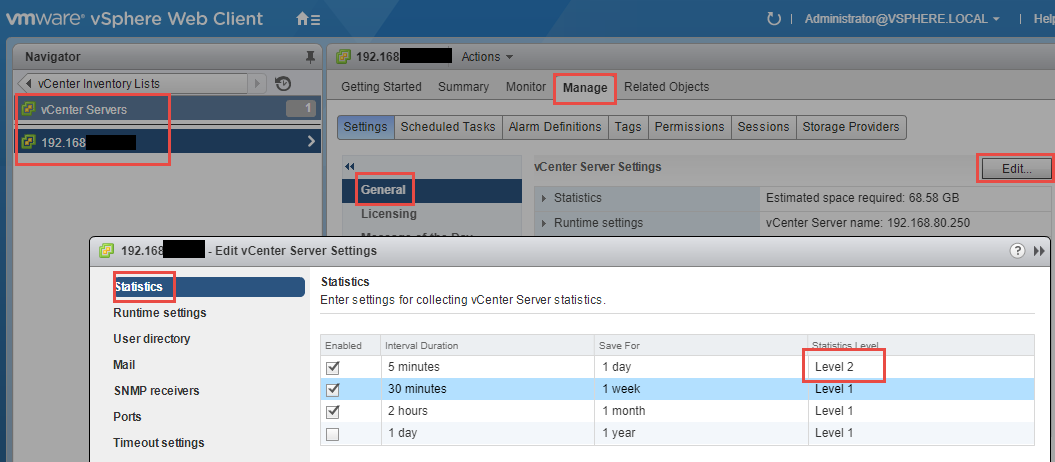
Otherwise some virtual machine metrics can’t be collected and the some charts will be empty.
IMPORTANT NOTE: Changing these statistics level result in a higher amount of data collected on the vCSA appliance. Also only change the first interval (5minute, 1 day), not the others.
Please make sure to check the estimated space required in the statistics section and your local partition free space:
Increase disk space: https://kb.vmware.com/s/article/2126276
What to do when a root partition is full: https://www.opvizor.com/vcenter-appliance-vcsa-root-partition-full
Some more blog posts about full vCSA: https://thevirtualist.org/vcsa-filesystem-is-out-of-disk-space/
Active Directory Authentification
Important: To enable the Active Directory authentication, the network settings of the appliance must configured to reach the AD server and the domain (AD Name Server, Domain Name).
Choose Auth in the main menu:
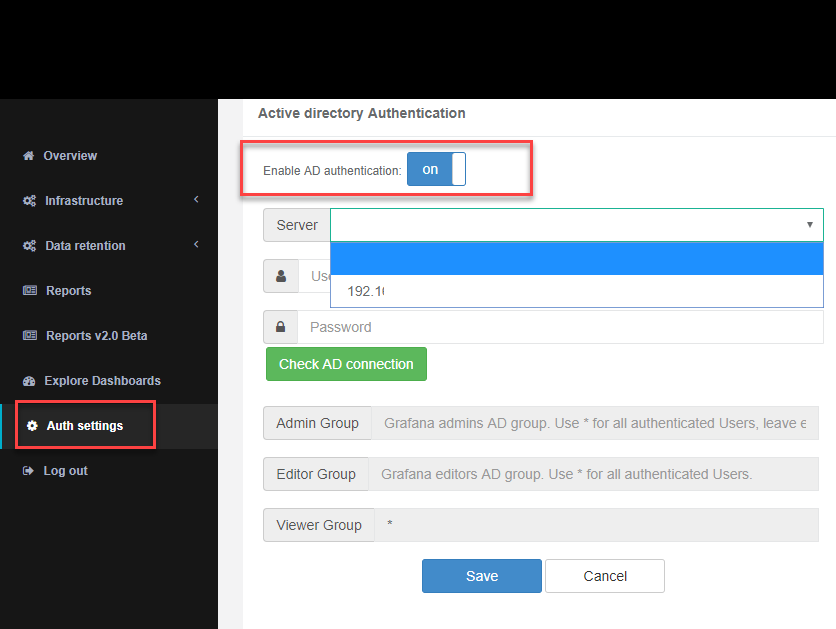
Enable the AD Authentication and select one of the Active Directory Controller shown.
Enter username and password of the AD user to search for the AD access groups and click Check AD connection.
- Retrieve your AD Root CA ca.cert and copy it to /data/docker_mounts/opagrafana-conf/ca.crt
- Update file permissions
chown 472:5000 /data/docker_mounts/opagrafana-conf/ca.crt - In /data/docker_mounts/opagrafana-conf/grafana.ini adjust the certificate verification flag to enable TLS verification
ssl_skip_verify = false - Restart the grafana container
docker restart opagrafana
If all goes well, select the Admin, Editor and Viewer group for the dashboards. You can type parts of the group name and search. The drop down selection box shows all found groups.
When everything is correctly configured AD user of the related group can log on. Please type only the username and password to login, not the domain!
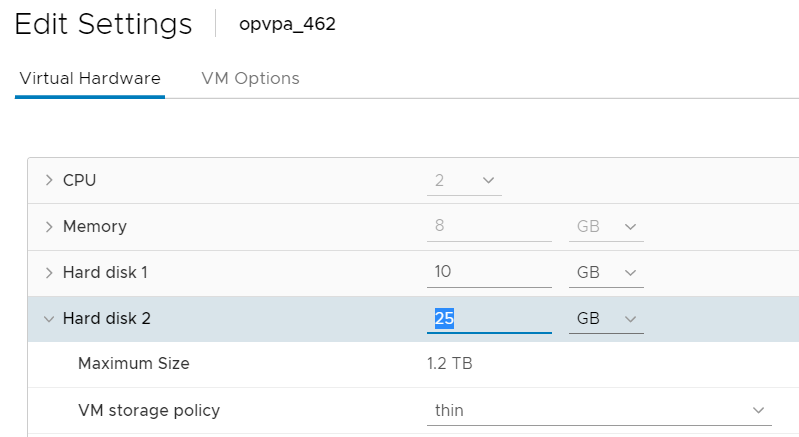
Increasing disk space:
To increase the disk space you can just change the disk capacity of the second disk and our system will automatically resize the data partition within 5 minutes.
Hint: If you can´t change the capacity, please delete existing VM snapshots.
Used Network Ports Opvizor Performance Analyzer Appliance
- Client > Opvizor Dashboard - TCP Ports 80,443
- Client > Opvizor SSH - TCP Port 22
- Opvizor > Mailserver - TCP Port 25
- Opvizor > DNS - UDP/TCP Port 53
- Opvizor > vCenter - TCP Port 443
- Opvizor > NetApp Filer - TCP Port 443
- Opvizor > NetApp HyperFlex - TCP Port 443
- Opvizor > Cisco UCS - TCP Port 443
- Opvizor > Active Directory - TCP Port 389
- Opvizor > Microsoft SQL - TCP Port 1433
- Opvizor > Oracle - TCP Port 1521
- when using telegraf - Windows/Linux system > Opvizor TCP Port 8086